
|Articles|March 5, 2019
Report: Higher Health Care Spending Caused by Rising Prices, Not Utilization
Author(s)Jennifer Barrett, Associate Editor
The 2017 Health Care Cost and Utilization Report examined medical and prescription drug spending, utilization, and average prices using health care claims data from 2013 through 2017 for Americans under the age of 65 who were covered by employer-sponsored insurance.
Advertisement
This article was originally published by
Despite little change in rates of health care utilization, average annual per-person health spending has increased for individuals with employer-sponsored insurance (ESI) over a 5-year period, according to a new report published by the Health Care Cost Institute (HCCI).
The analysis follows a previous HCCI report suggesting that the rising cost of insulin, not increased utilization, is responsible for higher spending among patients with diabetes.
The 2017 Health Care Cost and Utilization Report examined medical and prescription drug spending, utilization, and average prices using health care claims data from 2013 through 2017 for Americans under the age of 65 who were covered by ESI. Researchers monitored trends across 4 different types of services: inpatient, outpatient, professional services, and prescription drugs.
The report concluded that although overall spending growth slowed in 2017 compared with 2016, prices continued to drive up costs across a variety of the health care service categories analyzed.
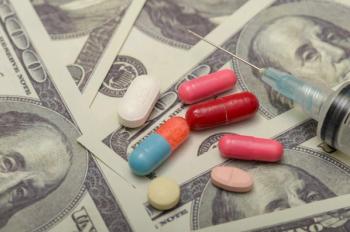
Fueled by these rising prices, employer-based health insurance spending reached a new all-time high at $5641 per person in 2017, according to HCCI. The per-person spending increase was slightly lower from 2016 to 2017, but the rate still exceeded 4% for the second year in a row. Total annual per-person spending increased 16.7% over the 5-year period. The report’s authors noted that these estimates reflect amounts paid at the time of purchase and do not include manufacturer rebates provided in separate transactions.
Based on payments at point-of-sale, spending on prescription drugs per person totaled $1065 in 2017. Spending on prescription medications and medical devices obtained at pharmacies was 29% higher than in 2013, according to the data.
However, spending trends varied across categories of services and disease states, with some treatment types showing a decline in costs per patient. For example, cardiovascular and central nervous system drugs had average point-of-sale declines of 36% and 15%, respectively. The authors noted this was likely because these diseases contain commonly prescribed drugs that went off patent during the period, allowing a shift from brand use to cheaper generic products.
Substantial price increases occurred in other areas, such as a 156% price jump during the period for treatments in RA. Other notable spending increases included hormones (55%), skin-related drugs (70%), and chemotherapy/antineoplastic agents (95%), according to the report.
Professional services spending grew 13% between 2013 and 2017, with the most drastic increase in spending observed for administered drugs. Chemotherapy agents and other drugs administered by physicians spiked 45% over the report period, despite a 12% decrease in utilization.
Overall, utilization of prescription drugs increased by 3% in 2017, representing a year-over-year uptick. Still, continued growth in point-of-sale prices contributed to an overall spending increase of 4.7% between 2016 and 2017, with a cumulative growth of 29% in the report period.
“These trends can inform specific efforts and policies to curb health care spending growth,” Jeannie Fuglesten Biniek, senior researcher and co-author of the report, wrote.
Reference
Fuglesten Biniek J, Hargraves J. 2017 Health Care Cost and Utilization Report. Health Care Cost Institute. February 12, 2019.https://www.healthcostinstitute.org/images/pdfs/HCCI_2017_%20Health_%20Care_Cost_and_Utilization_Report_02.12.19.pdf.
HCCI Releases 2017 Health Care Cost and Utilization Report [news release]. Health Care Cost Institute. https://www.healthcostinstitute.org/news/entry/2017-hccur. Accessed February 13, 2019.
Newsletter
Stay informed on drug updates, treatment guidelines, and pharmacy practice trends—subscribe to Pharmacy Times for weekly clinical insights.
Advertisement
Related Content
Advertisement


Latest CME


Advertisement
Advertisement
Trending on Pharmacy Times
1
TrumpRx Launches, Offering Cash-Paying Patients Discounted Drugs
2
Pharmacist Takeover: CAR T Therapy Signals a Shift in ALL Treatment
3
SGLT2 Inhibitors in T2D Lower 5-Year Risk of CKD and Acute Kidney Injury
4
Q&A: How Pharmacists Can Address Structural Barriers in Obesity Care
5