
|Articles|May 11, 2010
- May 2010 Skin & Eye Health
- Volume 76
- Issue 5
Top 200 Prescription Drugs of 2009
Author(s)Michael Bartholow, PharmD
Growth and demand in the pharmaceutical market was strong in 2009, even in a difficult economic climate, thanks in part to greater use of specialty pharmaceuticals. This article discusses trends in 2009, top-performing classes, and outlook for the future, and lists the top 200 drugs by sales and prescriptions dispensed for 2009.
Advertisement
Growth and demand in the pharmaceutical market was strong in 2009, even in a difficult economic climate, thanks in part to greater use of specialty pharmaceuticals. This article discusses trends in 2009, top-performing classes, and outlook for the future, and lists the top 200 drugs by sales and prescriptions dispensed for 2009.
Drug sales in the United States grew by 5.1% in 2009, reaching $300.3 billion.1 Although this was a marked improvement from the record low growth in 2007 and 2008, 2009 sales remained relatively meager compared with the double-digit gains seen a few years ago.1-4 To put it in perspective, the growth rate of drug sales in the United States has dropped below 5% only 3 times in the past 50 years.5
Top Performers
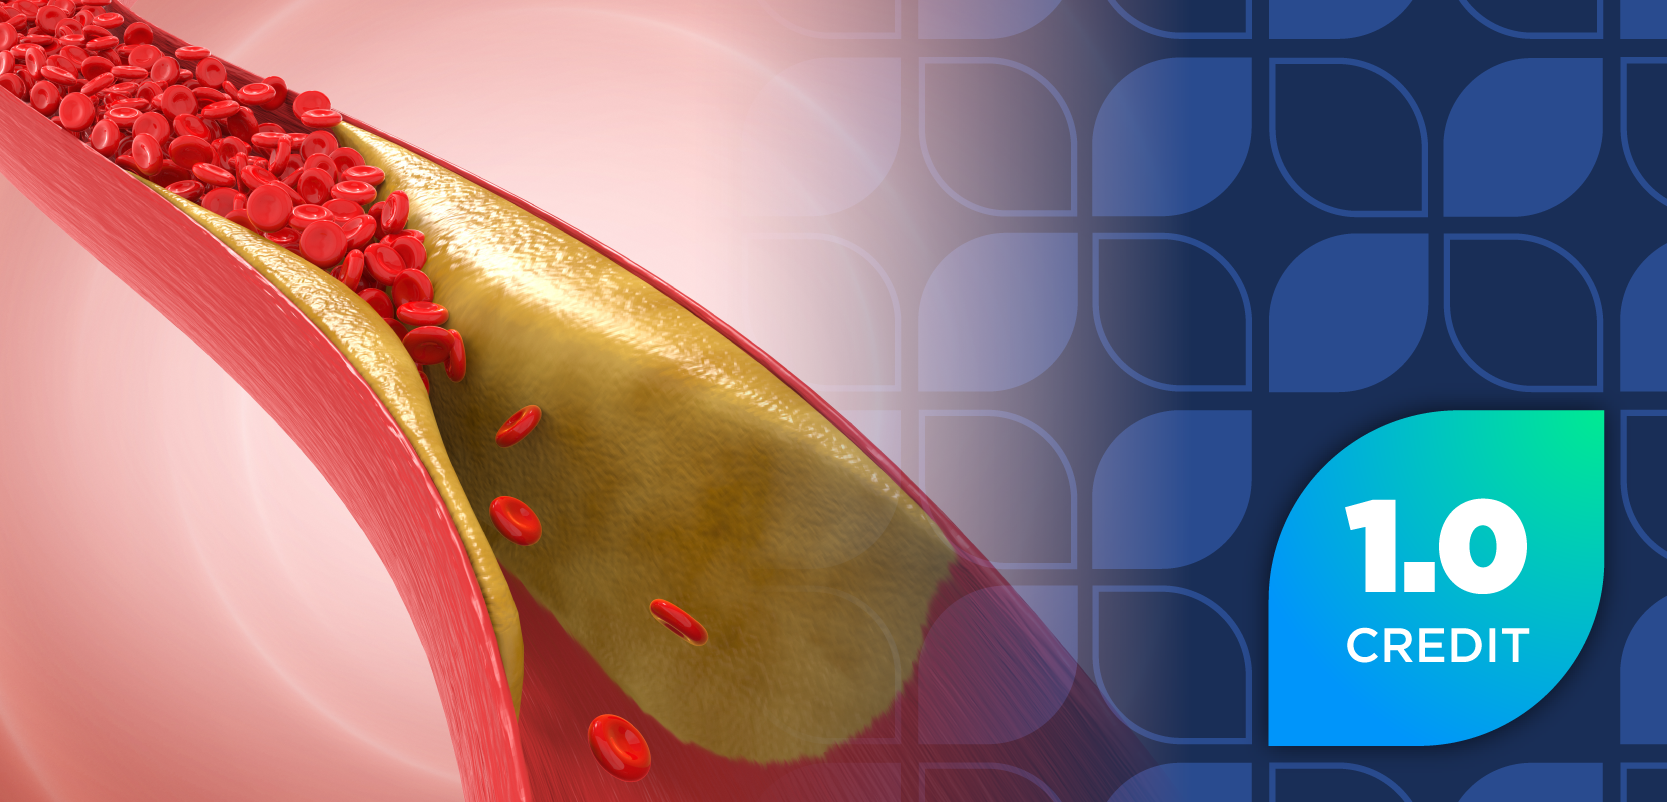
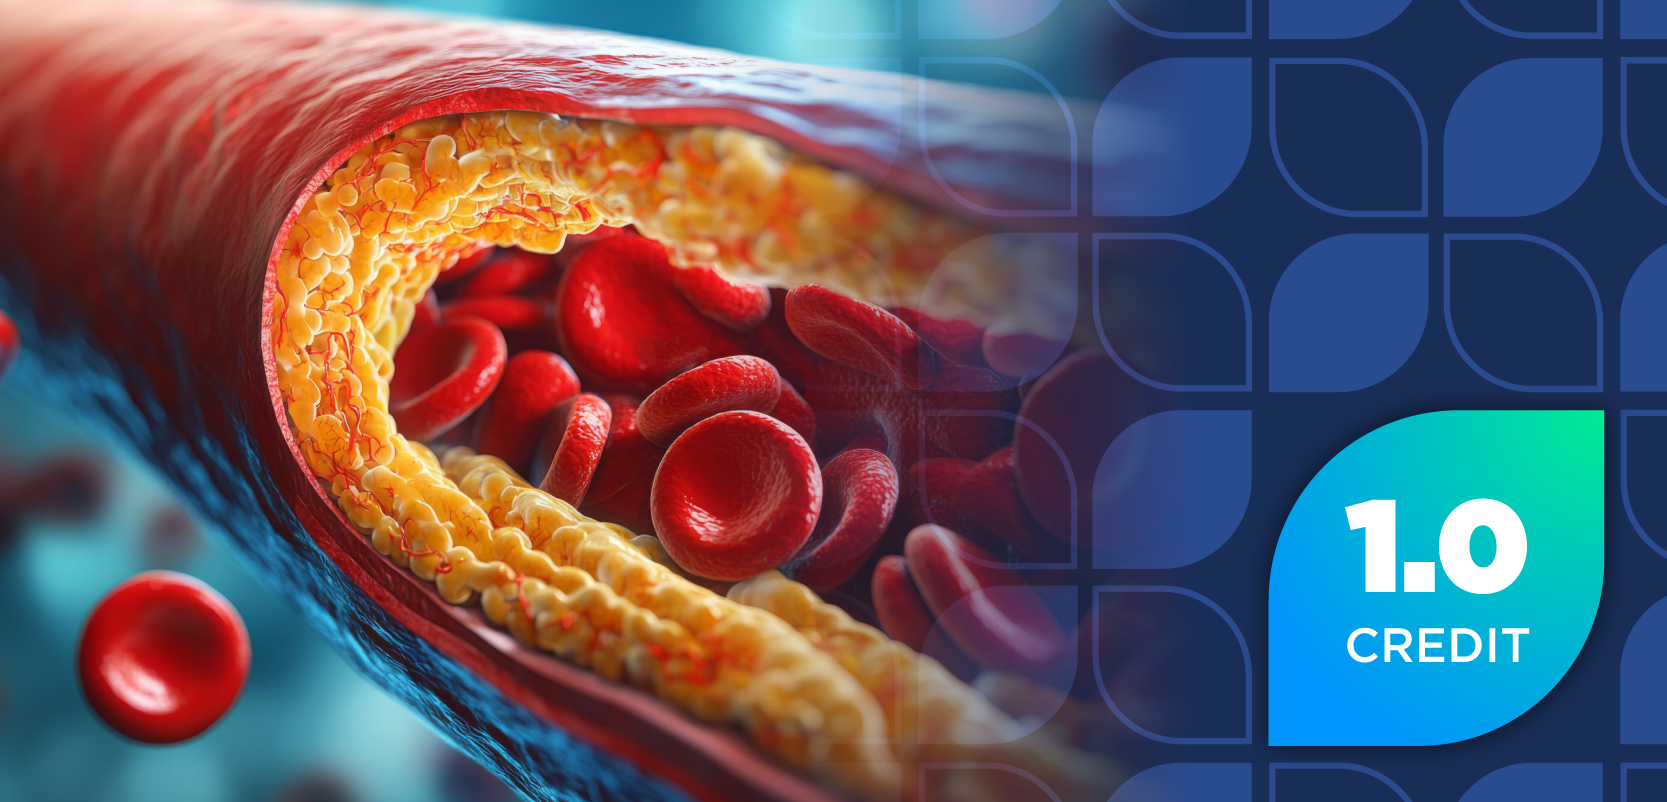
Antipsychotics were the highest grossing class of medications, with sales of $14.6 billion, followed by lipid regulators, which dropped 1% to $14.3 billion. Lipid regulators were also the most commonly prescribed medications, growing by 4% to an estimated 211 million prescriptions. Lipitor, manufactured by Pfizer, was the single highest grossing medication in 2009, although revenue actually decreased by approximately 3% to just over $7.5 billion. The third highest class in sales in 2009—proton pump inhibitors—experienced a 1% decline in sales but a 5% increase in prescriptions dispensed.1 The shift to less expensive generic alternatives may account for the loss in revenue despite the growth in prescription volume. Antidepressants were ranked fourth in total sales, growing by 4% to $9.9 billion.1,5 Table 1 shows the top 200 products in the US market by sales in 2009. Table 1 shows the top 200 products in the US market by sales in 2009. Table 1 shows the top 200 products in the US market by sales in 2009.
Growth and Demand Stay Strong
IMS Health credits several factors for the market growth in 2009, including stronger consumer demand, greater use of specialty pharmaceuticals, and no significant product safety issues.1 The number of prescriptions dispensed from retail channels grew roughly 2.1%, doubling the growth seen in 2008. Despite the difficult economic climate, a total of 3.9 billion prescriptions were dispensed last year.1 The top 200 products of 2009 by dispensed prescriptions are listed in Table 2. Programs developed by drug manufacturers, such as drug copay coupon offers, as well as the availability of low-cost generic medications, have helped to drive up sales.6 IMS Health also noted that “although the volume of new therapy starts in 17 major chronic disease areas declined by about 1%, the volume of add-on therapy starts, switches, and refills rose by nearly 2% last year.”1 The use of specialty pharmaceuticals grew by 7.5% and accounts for 21% of the US market value. Targeted cancer therapies such as Roche Holding AG’s Avastin, Herceptin, and Rituxan (comarketed with Biogen Idec Inc) saw a 9% increase in revenue and grew to be the sixth-largest drug class.1,7
Generics Continue to Prosper
The use of generic products, including branded generics, increased by 5.9% in 2009. Generics now represent 75% of prescriptions dispensed in the United States, up from 57% in 2004, and account for $74 billion in sales.5 IMS Health Senior Vice President Murray Aitken stated that the shift in utilization from branded to generic prescriptions was the result of “the greater availability of generic options, growing differentials in copays between brands and generics, and efforts by patients, insurers, and employers to encourage appropriate use of lower-cost alternatives.”1
Despite the increased volume, IMS Health noted that the impact of newly available generics in several treatment areas was less significant than in the past. The utilization of branded prescriptions declined by 7.6%, and the release of 32 new products in 2009 resulted in only a limited increase in drug spending.1
Changes on the Horizon
Over the next 5 years, several big patent expirations will continue to fuel the shift toward generic alternatives. IMS Health reports that the emergence of less expensive generics will “reduce total drug spending by about $80 billion to $100 billion worldwide through 2014.”8 The majority of the financial impact will be felt in the United States, peaking in 2011 and 2012 when 6 of the 10 highest grossing branded products will face generic competition. Among the products that will face patent expiration within the next 2 years include Pfizer’s top-selling Lipitor, Eisai’s Aricept, and Merck’s Cozaar and Hyzaar.8,9
In addition to the upcoming patent expirations, the Affordable Health Care for America Act will impose an annual fee on manufacturers of branded medications, institute Medicare and Medicaid rebates, and will prevent delays in the approval of generic alternatives.10 These measures may result in further growth of the utilization of generic alternatives. Merck projected that the impact of the health care reform legislation would result in a 1% decrease in the company’s revenue in 2010—roughly $170 million—and a reduction of $300 million to $350 million in sales in 2011.11 Lilly has estimated as much as a $700-million decrease in revenue next year.12
Despite the substantial reduction in drug spending that is expected to occur, IMS Health forecasts that the US market will continue to grow by 3% to 6% annually over the next 5 years, reaching $360 billion to $390 billion by 2014.8 â–
Click charts to enlarge
Dr. Bartholow is a clinical pharmacy specialist at VA Southern Nevada Healthcare System in Las Vegas, Nevada.
References
1.
IMS Health. IMS Health Reports U.S. Prescription Sales Grew 5.1 Percent in 2009, to $300.3 Billion. Press release. IMS Health Web site. April 1, 2010. http://www.imshealth.com/portal/site/imshealth/menuitem.a46c6d4df3db4b3d88f611019418c22a/?vgnextoid=d690a27e9d5b7210VgnVCM100000ed152ca2RCRD&vgnextchannel=41a67900b55a5110VgnVCM10000071812ca2RCRD&vgnextfmt=default. Accessed April 10, 2010.
2.
Lamb E. Top 200 prescription drugs of 2008. Pharmacy Times Web site. May 2009. http://www.pharmacytimes.com/issue/pharmacy/2009/2009-05/RxFocusTop200Drugs-0509. Accessed April 10, 2010.
3.
ArnoldM. US Rx Drug Sales Up 5.1% In 2009, Says IMS Health. MMM-Online.com Web site. March 31, 2010. http://www.mmm-online.com/us-rx-drug-sales-up-51-in-2009-says-ims-health/article/167070/. Accessed April 10, 2010.
4.
Staton T. Drug sales up 5.1% in 2009. Fiercepharma.com Web site. April 1, 2010. http://www.fiercepharma.com/story/drug-sales-growth-revs-back-5-1/2010-04-01. Accessed April 10, 2010.
5.
Berkrot B. US prescription drug sales hit $300 bln in 2009. Reuters.com Web site. April 1, 2010. http://www.reuters.com/article/idUSN3122364020100401. Accessed April 10, 2010.
6.
Perrone M.
US drug sales growth bounced back in 2009. Forbes.com Web site. April 1, 2010. http://www.forbes.com/feeds/ap/2010/04/01/business-health-care-providers-us-prescription-drug-sales_7481904.html. Accessed April 15, 2010.
7.
Tirrell M. Depression, Cancer Treatments Boosted Drug Sales 5.1% Last Year. Bloomberg.com Web site. April 1, 2010. http://www.businessweek.com/news/2010-04-01/depression-cancer-treatments-boosted-drug-sales-5-1-last-year.html. Accessed April 10, 2010.
8.
IMS Health. IMS Forecasts Global Pharmaceutical Market Growth of 5-8% Annually through 2014; Maintains Expectations of 4-6% Growth in 2010. Press release. IMS Health Web site. April 20, 2010. http://www.imshealth.com/portal/site/imshealth/menuitem.a46c6d4df3db4b3d88f611019418c22a/?vgnextoid=4b8c410b6c718210VgnVCM100000ed152ca2RCRD&vgnextchannel=41a67900b55a5110VgnVCM10000071812ca2RCRD&vgnextfmt=default. Accessed April 23, 2010.
9.
Jones L. Big Patent Expirations of 2010. Fiercepharma.com Web site. February 10, 2010. http://www.fiercepharma.com/special-reports/big-patent-expirations-2010. Accessed April 20, 2010.
10.
Sanzo KM, Miller AR. United States: Healthcare Reform Law: Impact on Pharmaceutical Manufacturers. Mondaq.com Web site. April 20, 2010. http://www.mondaq.com/unitedstates/article.asp?articleid=98662&login=true&nogo=1. Accessed April 23, 2010.
11.
Loftus P. Merck Discloses Health-Overhaul Costs. WallStreetJournal.com Web site. April 23, 2010. http://online.wsj.com/article/SB10001424052748703709804575202360211492040.html?mod=WSJ_latestheadlines. Accessed April 23, 2010.
12.
Staton T. Drug prices jump 9.1% in biggest rise of the decade. Fiercepharma.com Web site. April 20, 2010. http://www.fiercepharma.com/story/drug-prices-jump-9-1-biggest-rise-decade/2010-04-20. Accessed April 23, 2010.
Articles in this issue
over 15 years ago
May Online Exclusivesover 15 years ago
Can You Read These Rxs?over 15 years ago
Case Studiesover 15 years ago
Compounding Hotlineover 15 years ago
Pharmacy Guide: Cholesterolover 15 years ago
Diabetes Watchover 15 years ago
Arthritis Watchover 15 years ago
Skin & Eye Health Watchover 15 years ago
Women's Health Watchover 15 years ago
Tech Product NewsNewsletter
Stay informed on drug updates, treatment guidelines, and pharmacy practice trends—subscribe to Pharmacy Times for weekly clinical insights.
Advertisement
Related Content
Advertisement


Latest CME


Advertisement
Advertisement
Trending on Pharmacy Times
1
Nipah Outbreak in India Poses Low Global Risk Despite Lack of Approved Treatments
2
TrumpRx Launches, Offering Cash-Paying Patients Discounted Drugs
3
Q&A: Making Plant-Based Eating Practical in Pharmacy-Led Cardiometabolic Care
4
Pharmacist Takeover: CAR T Therapy Signals a Shift in ALL Treatment
5